Document visualization에 대한 survey paper입니다.
읽은 날짜 2023.10.15
카테고리 #DataVisualization, #DocumentVisualization, #시각화논문리뷰
Document visualization: an overview of current research
- Authors: Qihong Gan, Min Zhu, Mingzhao Li, Ting Liang, Yu Cao and Baoyao Zhou
- DOI: https://doi-org-ssl.libproxy.snu.ac.kr/10.1002/wics.1285
- Keywords: 배경/문제점:
- Issue Date: Jan 2014
- Publisher: WIREs Computational Statistics Volume 6, Issue 1 (Pages 1-73)
ABSTRACT
배경 > 문제점 > 목표(RQ) > 방법 > 평가 > 결과 > 의의
배경/문제점: 문서의 양이 폭발적으로 증가함에 따라, 사용자가 문서의 내용과 features를 이해 하고, 숨겨진 정보를 발견하는 것을 돕는 직관적인 시각화 툴이 절실히 필요해졌다.
목표: Document visualization에 대한 기본 개념(fundamental concepts)과 디자인, 대표적인 방법, 향후 과제를 소개한다.
각 카테고리 별로 대표적인 Document visualization 방법의 이론적 근거(rationale)과 특징(characteristics)을 설명하는데 초점을 둔다.
마지막으로 이 논문에서 리뷰한 방법들을 분류한 방식(classification)에 대한 한계에 대해 논한다.
1. INTRODUCTION
■ 텍스트 데이터의 증가
정보의 생산, 캡처, 저장 기술발달로 데이터의 폭발적인 증가
-예) library works, papers, news articles, criminal case reports, web pages, emails 등.
■ Document visualization
텍스트 정보(textual information: words, sentences, documents) 및 텍스트 정보들간의 관계를 시각적인 형태로 변형하여, 텍스트 문서의 이해를 돕고, 너무 많은 문서 처리에서 오는 정신적 노동(mental workload)의 부하를 줄여준다.
핵심 텍스트 내용을 제외하고, attributes(속성)과 메타데이터를 포함하는 시각화에 집중한다.
<Document visualization이 많은 양의 텍스트 정보 분석을 돕는 예>
(1) word frequency or distribution;
(2) semantic content and repetition;
(3) the topic or topics that define document clusters;
(4) the core content of document;
(5) similarity among documents;
(6) the connections among documents;
(7) how content changes over time; and
(8) information diffusion or other interesting patterns in social media,as well as improve text searches
2. DOCUMENT AND DOCUMENT VISUALIZATION DESIGN
■ Document
- 일반적으로 정보를 글자형태로 기록한 것(실체가 있거나, 표현이 있는 것) (textual record or physical form/representation of 'information')
- metadata: 예) 작가, 생성일, 수정일, 코멘트, 크기
■ Ben Shneiderman의 mantra
(suggested in a form of mantra that an effective information visualization tool should follow the principle:
Overview first, Zoom and filter, then details on demand
- 위의 만트라는 information visualization을 위한 task taxonomy(태스크 분류)를 함께 제공하며,
태스크는 고수준으로 추상회된 7가지가 있다.
(1) Overview. Gain an overview of the entire collection.
(2) Zoom. Zoom in on items of interest.
(3) Filter. Filter out uninteresting items.
(4) Details-on-demand. Select an item or group and get details when needed.
(5) Relate. View relationship among items.
(6) History. Keep a history of actions to support undo, replay, and progressive refinement.
(7) Extract. Allow extraction of sub-collections and of the query parameters.
3. OVERVIEW OF DOCUMENT VISUALIZATION METHODS
3.1 Single Document Visualization
■ 아이템
설명
설명
3.1.1 Vocabulary-Based Visualization


■ Tag Clouds and Wordle
설명
설명

■ TextArc
설명
설명

■ DocuBurst
설명
설명
3.1.2 Visualization Based on Semantic Structure

■ Semantic Graphs
설명
설명
3.1.3 Visualization Based on Document Content

■ WordTree
설명
설명

■ Martin Wattenberg's Arc Diagram
설명
설명
3.2 Document Collection Visualization
■ 아이템
설명
설명
3.2.1 Visualization of Document Themes

■ ThemeScapes
설명
설명
■ IN-SPIRE's ThemeView, and The Galaxy
설명
설명
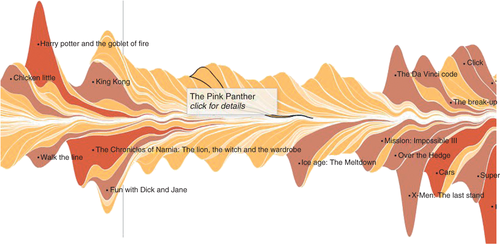
■ ThemeRiver
설명
설명
■ Topic Island
설명
설명
3.2.2 Visualization of Document Core Content

■ Document Cards
설명
설명
3.2.3 Visualization of Changes over Different Versions

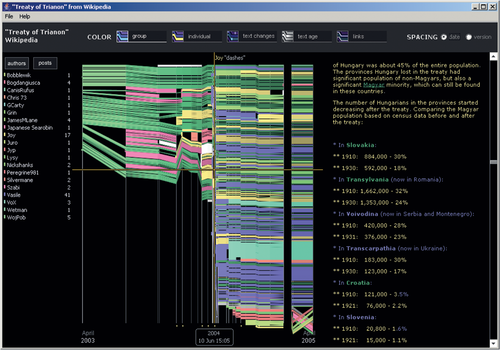
■ History Flow
설명
설명
■ Software visualization
- SeeSoft, Augur, Advizor: - 코드 문서 시각화 (visualizations for code documents)
- Beagle : 다른 릴리즈 버전들 간의 차이를 시각화
- Spectrograph: 시스템에서 변경사항이 일어난 시각과 장소를 보여줌.
3.2.4 Visualization of Document Relationships

■ Jigsaw
설명
설명
3.2.5 Visualization of Document Similarity
■ The self-organizing map (SOM)
- nonlinear projection method
- 비선형적이고 복잡한 고차원 데이터 아이템을 간단한 geometric 관계로 2D로 시각화
3.3 Extended Document Visualization
■ 아이템
설명
설명
4. DISCUSSION
■ 아이템
설명
설명
Principles (위에서 언급되었지만, 보기 쉽게 다시 적어둠.)
(1) Overview. Gain an overview of the entire collection.
(2) Zoom. Zoom in on items of interest.
(3) Filter. Filter out uninteresting items.
(4) Details-on-demand. Select an item or group and get details when needed.
(5) Relate. View relationship among items.
(6) History. Keep a history of actions to support undo, replay, and progressive refinement.
(7) Extract. Allow extraction of sub-collections and of the query parameters.
| Classification | Representative Methods | Characteristics Visualized | Principle Satisfied | Requirements for a Document | Main Features | |
| Single document | Vocabulary-based visualization | Tag Clouds /Wordle | Word frequency | 1, 3, 6 | Arbitrary text documents | Strong versatility; interactive |
| Textarc | Word frequency and distribution | 1, 3, 4, 5 | Arbitrary text documents | |||
| Docuburst | Word frequency and human-created structure in lexical databases | 1, 2, 3, 4, 5, 7 | Arbitrary text documents | |||
| Visualization based on semantic structure | Semantic graphs | Semantic content | 1, 3, 5 | Arbitrary text documents | Limited interactivity; relatively strong versatility | |
| Visualization based on document content | Wordtree | Word frequency and their context | 1, 2, 3, 4, 5, 6, 7 | Arbitrary text documents | Weak interactivity; versatile | |
| Arc diagrams | Patterns of repetition | 1 | Sequence based (Music, Code, Web Page, DNA) | Static | ||
| Document collections | Visualization of document themes | Themescapes/Themeview/Galaxy view | Relationships between various topics | 1, 5 | Certain theme needed in the document | Versatile within a certain range; weak interactivity |
| TopicNets | Topics and their relations | 1, 2, 3, 4, 5, 6, 7 | Topic based | Versatile; strong interactivity | ||
| Themeriver | Thematic variations over time | 1, 5 | Theme based | Versatile; weak interactivity | ||
| Visualization of document core content | Document cards | Core content of a collection of documents | 1, 2, 3, 4 | Both text and image contained in the document (Paper, News Feeds) | Relatively weak interactivity; high utilization of space | |
| Visualization of changes over versions | History flow | Content changes between multiple document versions | 1, 2, 3, 4, 5, 6 | Different versions generated over time, (Wikipedia documents) | Limited interactivity; versatile | |
| Visualization of document relationships | Jigsaw | Connections among document collections (especially connections among entities) | 1, 2, 3, 4, 5, 6, 7 | Facts or observations described in document (news stories, case reports) | Multiple view; strong interactivity | |
| Visualization of document similarity | WEBSOM | Similarity among document collections | 1, 2, 4, 5,7 | Arbitrary ext documents | Versatile | |
7. CONCLUSION
■ 현재 방식에서 개선가능한 부분 (Improvement of Current Methods )
1. Extension(확장)
2. Versatility (다양성)
3. Interactivity (상호작용성)
4. Techniques (기술)
- Algorithms (알고리즘)
- Parallel processing technology (병렬 처리 기술)
- Real-time processing technology (실시간 처리 기술)
■ 현재 방식과 다른 방식의 결합 (Combination of Current Methods and Others)
1. 다양한 document visualization 방법들을 결합
2. Document visualization 방법을 다른 information visualization 방법과 결합
3. Visual data mining - document visualization을 text data mining의 프로세스에 적용.
■ 적용 영역 (Application)
1. Social Media
2. Mobile Internet - 인터넷 로그와 같은 대규모 텍스트 데이터 분석에 적용
■ 검증과 이론 (Evaluation and Theory)
1. Evaluation
- document visualization은 품질을 평가하기위한 정량적인 측정방법이 부족하다.
2. Theoretical Foundations
- 미래 연구들을 위한 주요 방향으로 collaborative information visualization with theory building 이 있다.
나의 의견
논문을 선택한 이유
(1) 어쩌다 Google scholar를 통해 WIRES 라는 저널의 홈페이지를 알게 됬는데, 여기서 추천해주는 논문들을 타고 타다 가 발견한 논문이다. 내가 그동안 찾던 주제와 꼭 들어맞아서 바로 읽게 되었다.
한가지 아쉬운 점은, 논문이 2013년에 쓰여진 (2014년 발행) 논문이라 거의 10년 전의 정보를 갖고있다는 것이다.
비슷한 최신 논문을 하나 찾고 싶은데, 잘 없다. 그 사이에 별로 업데이트 된 게 없는건지 내가 못찾는 건지! (아마도 후자 같다.)
읽고 난 후 의견
- Ben Shneiderman의 mantra는 이전에 교수님께서 면담때 한번 알려주셨던 거라 이번 논문에 인용되있는 것을 보니 반가웠다.
- 그의 mantra는 information visualization 도구를 위한 것으로, 모든 인터페이스에 해당하는 것이라고 생각하지는 않는다.
- 인터페이스에 시각화가 들어갈 때, 이 시각화의 목적에 따라 어느 정도 디테일이 제공될 지는 달라질 것이다.
- 예를 들어, 그의 mantra는 데이터 분석을 위한 툴 설계시에는 필히 먼저 고려되어야 할 기본 원칙이라 생각된다.
- 하지만 데이터 분석을 위한 것이 아니라 단순히 데이터를 보여주기 위하여 (아무래도 텍스트 보다는 시각적인 것이 먼저 눈에 들어오니까) 마치 인포그래픽과 같은 목적으로 시각화를 한 것이라면, mantra의 내용을 굳이 다 따를 필요는 없지 않을까?
'논문 리뷰' 카테고리의 다른 글
| (-ing) UrbanComputing: Concepts, Methodologies, and Applications (0) | 2024.02.06 |
|---|
